Conventional Technical Analysis
Let me give you a word of advice, which can save you lots of money and time: Forget about conventional technical analysis! Conventional technical analysis doesn't Work. Simulations show, that standard indicators are useless. You need more processing power nowadays to beat the market.
I've wasted enough time analyzing the effectiveness of all those moving averages, candlesticks, MACD, relative strength indices, Elliot waves, Bollinger bands, etc. Possibly they worked at the time they were invented (it would be an interesting exercize to check it), but you can be sure - not anymore. Some of the results of standard technical analysis indicators simulations I published twelve years ago in my master thesis.
How much time have you wasted until now? How much have your friends wasted? How much time have all investors wasted? Countless hours. At least, I hope, after reading this, you won't waste it any more.
Non-Conventional Technical Analysis
Is there any type of technical analysis that works? Maybe there is. But it cannot be a common knowledge, because it then looses it's predicting power. Any technical analysis, which is not part of a mainstream knowledge, has more potential to be effective (and ineffective i.e. under-performing as well). The problem is finding the ones that work. Those under-performing stocks are very interesting too, because one can leverage the investment by shorting them. So if you find those, you should be happy.
As part of the previously mentioned master thesis, I also analyzed the effectiveness of Neural Networks and a method called Case Based Reasoning. Case Based Reasoning is in short about finding cases from the past (patterns) and projecting into the future. None of those techniques could beat the market if transaction fees were considered. Here I present the results of the second technique.
CBR Method used
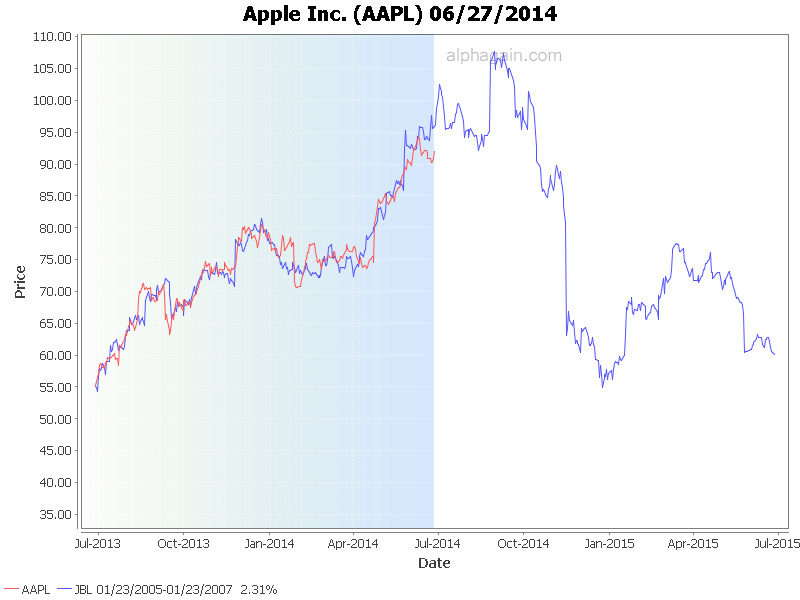
The CBR method used finds the best matching past patterns and shows how the price behaved in the past. Here I present three types of charts. The first chart just shows the best matching pattern found.
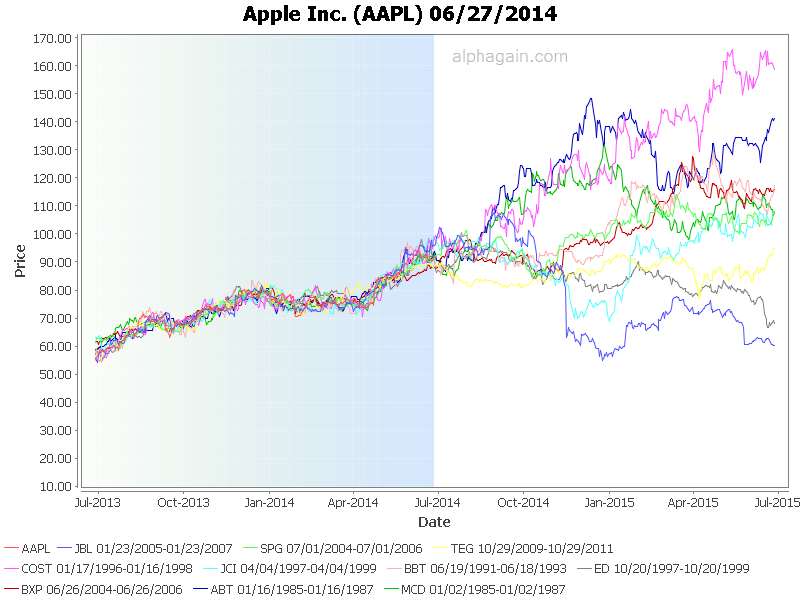
The second chart shows ten best matching quotes. Also which quotes and when are listed at the bottom of it.
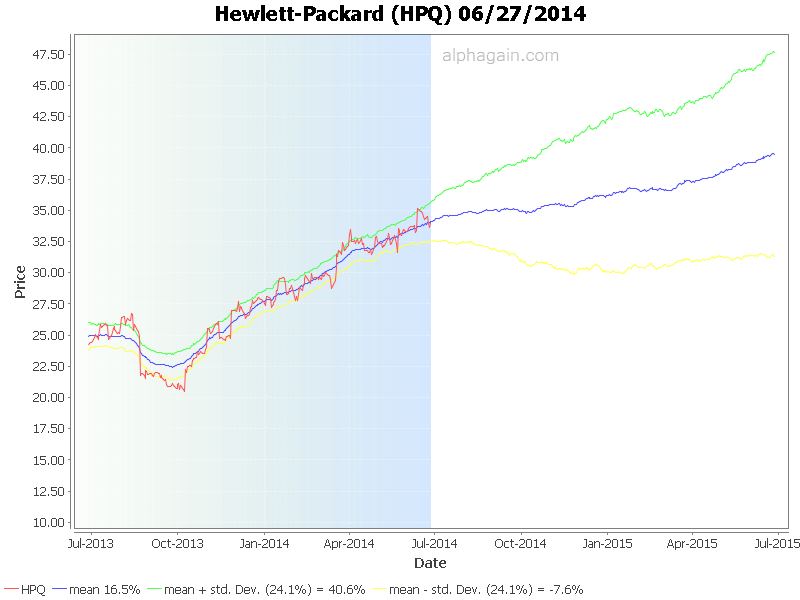
And this one is the most interesting one. It averages the best 100 matches and calculates the standard deviation, drawing the upper and lower standard deviation bands (Green and Yellow). The blue line is the mean value.

Additional information
Currently only S&P 500 companies are listed here. If a company has less than a year of historical data, charts are not available.
Due to limited time and resources, I am running the calculation on the weekends only.
I wish you a great investment performance!

